
Maximizing Business Impact with ANOVA: Key to Data-Driven Strategy
- Pratima Suresh Kumar
- Mar 16, 2024
- 2 min read
ANOVA refers to the analysis of variance. This statistical tool is highly essential in understanding if the impact of a predictor or predictors is by chance or not. The assumptions of ANOVA are equal variances across groups, normality of data, and independence of data observations.
INDEPENDENCE OF OBSERVATION
The data collection process should ensure that there is zero dependency between groups. This means that feedback from the first marketing campaign of a product should not ideally influence the customer’s perception of another feedback for a second marketing campaign.
NORMALITY OF DATA
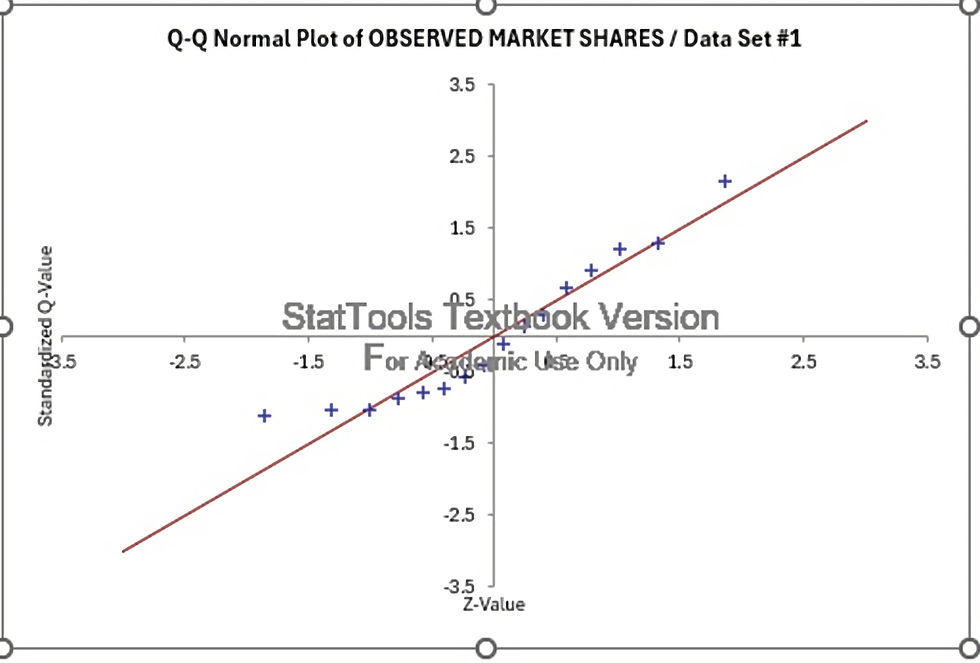
The data within each group needs to be normally distributed. If the sample size is huge, the assumption is not as highly critical as the Central Limit Theorem highlights the presence of normality. Q-Q plot could be used to examine the normality in data.
Below plot denotes that the data points are normal as they lie around the red line which is an indication of normality:
EQUAL VARIANCES ACROSS GROUPS
Within-group variances need to be equal for ANOVA to be an effective tool in data analysis and business decision-making. Some tests that could be used are :
TEST | CRITERIA |
Levene’s test | Used when one suspects that data is not normally distributed (scipy.stats.levene) |
Bartlett’s test | Used when one is sure of normality in data (scipy.stats.bartlett) |
The primary use of ANOVA is to choose a set of predictors that impact the dependent variable. One-way Anova further helps to focus on the relationship between the chosen independent variable and the dependent variable. It is highly used in exploratory data analytics to specifically understand the behavior of the dependent variable. The magnitude of impact helps determine business decisions.
In the below image, one-way ANOVA is performed. The “stress --reduction” is considered as the independent variable and the “Total Number of Minutes” is considered as the dependent variable. The F ratio is significant which denotes that there is a significant difference in stress levels when there is variation in “Total Number of Minutes Exercised”. A sig value below 0.05 and F ratio above 1 suggest that there is an impact in the dependent variable when the independent variable varies.
ONE WAY ANOVA

As part of Linear regression, the ANOVA considers all the predictors at once and measures the impact of predictors as indicated by “Sum of Squares – Regression”. The “Sum of Squares- residual” indicates that the magnitude of impact on “Total Number of Minutes Exercised” which was random. An F ratio is an important metric to further understand if the Dependent variable is majorly impacted by predictors or random causes. A higher F ratio in combination with Sig value of less than 0.05 indicates that the “Total Number of Minutes Exercised” is impacted by the independent variables chosen for analysis. A combination of variables could be chosen to understand the overall impact on the dependent variable.

APPLICATION OF ANOVA
Domain | Business Problem | Independent Var/Predictors | Dependent Variables | Business Value/Outcome |
Marketing | Understanding impact of multiple campaigns on Sales Volume | Various Campaigns | Sales Volume | Ability to choose a specific campaign for real-time implementation on a larger population for improving profit. |
Finance | Assessing the impact of fraud detection mechanisms on customer transaction across different branches or geographies | Card Authentication ,Biometric Verification
| Prevention Rate or Time for Detection | Ability to measure the impact of each method and further update the strategy if the Time for Detection is high. |
Product | Evaluating impact of newly created product features on customer usage rates and new customer acquisition rate | Ease of use of AI-based assistant for a product like Teams/Zoom | Customer Usage frequency | Ability to select top-performing features and move on to full-scale implementation across geographies |
By offering a strong framework for evaluating group difference hypotheses, ANOVA goes beyond fundamental analytical methods and promotes a deeper comprehension of intricate data interactions. Businesses can now anticipate and deliberately navigate market shifts rather than just reacting to them because to its combination with exploratory data analytics. Therefore, becoming proficient in ANOVA gives professionals a valuable tool for enhancing business intelligence, refining plans, and eventually propelling profitable business expansion and innovation.


Comments