
Unlocking the Secrets of Model Fit: Essential Insights for Predictive Accuracy
- Pratima Suresh Kumar
- Mar 18, 2024
- 2 min read
From my learning experience in the MS BA course, I learnt the use of stats tools from Excel and SPSS for descriptive statistics. The basic step of model building is to first understand the data. Multiple parameters like mean, median, mode, range, standard deviation, and variance are used to understand the data distribution. The range of data, mean, and standard deviation help in understanding the data. A higher standard deviation denotes abnormalities in the data like the presence of outliers. The method used is linear regression and ANOVA. Linear Regression explains the relationship between dependent and independent variables.

The X variable represents the different predictors in consideration. The Beta parameters represent the estimated change in Y with one unit of change in the corresponding x variables.
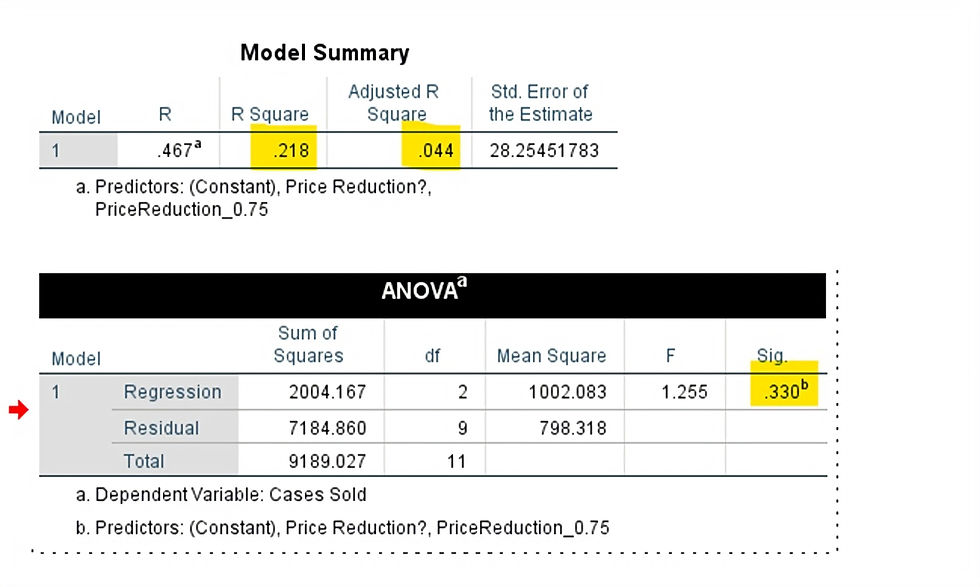
The model summary denotes 3 parameters: R,R square, and Adjusted R square. R denotes the strength and direction of the linear relationship between the dependent and independent variables in the regression analysis. R square denotes the explanatory power of the regression model and not the direction of the relationship. If the R square is closer to 1, it denotes that the model would fit and explain a linear relationship to any other random sample of the dataset.
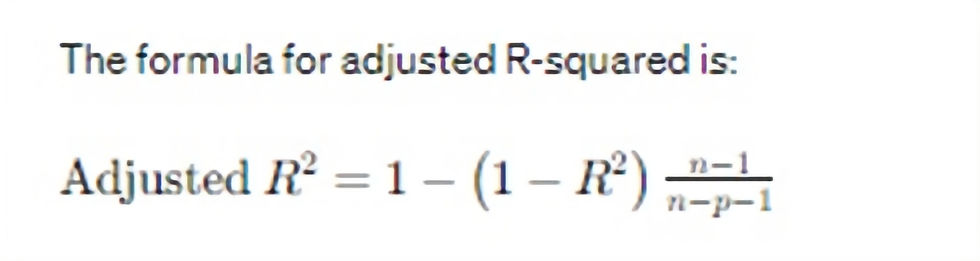
As per the above screenshot, the Adjusted R Square is very low. The adjusted R square denotes the impact of “price reduction” on “cases sold”. A value of 0.70 and above denotes significant impact. Adjusted R square is a better metric than R square because it considers the number of predictors while R square does not. The R square magnitude increases as we add more predictors. Hence, the Adjusted R square is a better metric. As per the below formula, we observe “n” is present in the formula.
VIF

Post exploring the tools like SPSS Statistics and Excel Stat Tools to build models,I have understood that multiple parameters like p value,Adjusted R square,VIF ,F ratio and Sum of Squares are highly critical in understanding the behavior of dependent variables .


Comments